We have all heard stories of whizzes who can take a company’s accounts apart in minutes, calculate a few financial ratios, and discover the company’s innermost secrets. The truth, however, is that financial ratios are no substitute for a crystal ball. They are just a convenient way to summarize large quantities of financial data and to compare firms’ performance. Ratios help you to ask the right questions: they seldom answer them.
 We will describe and calculate four types of financial ratios:
Leverage ratios show how heavily the company is in debt.
Liquidity ratios measure how easily the firm can lay its hands on cash.
Efficiency or turnover ratios measure how productively the firm is using its assets.
Profitability ratios are used to measure the firm’s return on its investments.
We introduced you to PepsiCo’s financial statements in Accounting and Finance.
Now let’s analyze them. For convenience, Tables A.7 and A.9 present again Pepsi’s income statement and balance sheet.
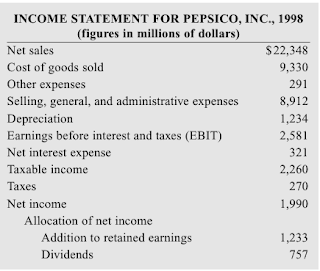
The income statement summarizes the firm’s revenues and expenses and the difference between the two, which is the firm’s profit. You can see in Table A.7 that after deducting the cost of goods sold and other expenses, Pepsi had earnings before interest and taxes (EBIT) of $2,581 million. Of this sum, $321 million was used to pay debt interest (remember interest is paid out of pretax income), and $270 was set aside for taxes.
The net income belonged to the common stockholders. However, only a part of this income was paid out as dividends, and the remaining $1,233 million was plowed back into the business.
The income statement in Table A.7 shows the number of dollars that Pepsi earned in 1998. When making comparisons between firms, analysts sometimes calculate a common-size income statement. In this case all items in the income statement are expressed as a percentage of revenues. Table A.8 is Pepsi’s common-size income statement. You can see, for example, that the cost of goods sold consumes nearly 42 percent of revenues, and selling, general, and administrative expenses absorb a further 40 percent.
Whereas the income statement summarizes activity during a period, the balance
sheet presents a “snapshot” of the firm at a given moment. For example, the balance sheet in Table A.9 is a snapshot of Pepsi’s assets and liabilities at the end of 1998.
 The accountant lists first the assets that are most likely to be turned into cash in the near future. They include cash itself, short-term securities, receivables (that is, bills that have not yet been paid by the firm’s customers), and inventories of raw materials, work-in-process, and finished goods. These assets are all known as current assets. The second main group of assets consists of long-term assets such as buildings, land, machinery, and equipment. Remember that the balance sheet does not show the market value


of each asset. Instead, the accountant records the amount that the asset originally cost and then, in the case of plant and equipment, deducts an annual charge for depreciation.
Pepsi also owns many valuable assets, such as its brand name, that are not shown on the balance sheet.
Pepsi’s liabilities show the claims on the firm’s assets. These also are classified as current versus long-term. Current liabilities are bills that the company expects to pay in the near future. They include debts that are due to be repaid within the next year and payables (that is, amounts the company owes to its suppliers). In addition to these short-term debts, Pepsi has borrowed money that will not be repaid for several years. These are shown as long-term liabilities.
After taking account of all the firm’s liabilities, the remaining assets belong to the common stockholders. The shareholders’ equity is simply the total value of the assets less the current and long-term liabilities.2 It is also equal to the amount that the firm has raised from stockholders ($1,195 million) plus the earnings that have been retained and reinvested on their behalf ($5,206 million).
Just as it is sometimes useful to provide a common-size income statement, so we can also calculate a common-size balance sheet. In this case all items are reexpressed as a percentage of total assets. Table A.10 is Pepsi’s common-size balance sheet. The table shows, for example, that in 1998 cash and marketable securities fell from 9.6 percent of total assets to 1.4 percent.
LEVERAGE RATIOS
When a firm borrows money, it promises to make a series of interest payments and then to repay the amount that it has borrowed. If profits rise, the debtholders continue to receive a fixed interest payment, so that all the gains go to the shareholders. Of course, the reverse happens if profits fall. In this case shareholders bear all the pain. If times are sufficiently hard, a firm that has borrowed heavily may not be able to pay its debts.
The firm is then bankrupt and shareholders lose their entire investment. Because debt increases returns to shareholders in good times and reduces them in bad times, it is said to create financial leverage. Leverage ratios measure how much financial leverage the firm has taken on.
Leverage ratios show how heavily the company is in debt.
Liquidity ratios measure how easily the firm can lay its hands on cash.
Efficiency or turnover ratios measure how productively the firm is using its assets.
Profitability ratios are used to measure the firm’s return on its investments.
We introduced you to PepsiCo’s financial statements in Accounting and Finance.
Now let’s analyze them. For convenience, Tables A.7 and A.9 present again Pepsi’s income statement and balance sheet.
The income statement summarizes the firm’s revenues and expenses and the difference between the two, which is the firm’s profit. You can see in Table A.7 that after deducting the cost of goods sold and other expenses, Pepsi had earnings before interest and taxes (EBIT) of $2,581 million. Of this sum, $321 million was used to pay debt interest (remember interest is paid out of pretax income), and $270 was set aside for taxes.
The net income belonged to the common stockholders. However, only a part of this income was paid out as dividends, and the remaining $1,233 million was plowed back into the business.
The income statement in Table A.7 shows the number of dollars that Pepsi earned in 1998. When making comparisons between firms, analysts sometimes calculate a common-size income statement. In this case all items in the income statement are expressed as a percentage of revenues. Table A.8 is Pepsi’s common-size income statement. You can see, for example, that the cost of goods sold consumes nearly 42 percent of revenues, and selling, general, and administrative expenses absorb a further 40 percent.
Whereas the income statement summarizes activity during a period, the balance
sheet presents a “snapshot” of the firm at a given moment. For example, the balance sheet in Table A.9 is a snapshot of Pepsi’s assets and liabilities at the end of 1998.
of each asset. Instead, the accountant records the amount that the asset originally cost and then, in the case of plant and equipment, deducts an annual charge for depreciation.
Pepsi also owns many valuable assets, such as its brand name, that are not shown on the balance sheet.
Pepsi’s liabilities show the claims on the firm’s assets. These also are classified as current versus long-term. Current liabilities are bills that the company expects to pay in the near future. They include debts that are due to be repaid within the next year and payables (that is, amounts the company owes to its suppliers). In addition to these short-term debts, Pepsi has borrowed money that will not be repaid for several years. These are shown as long-term liabilities.
After taking account of all the firm’s liabilities, the remaining assets belong to the common stockholders. The shareholders’ equity is simply the total value of the assets less the current and long-term liabilities.2 It is also equal to the amount that the firm has raised from stockholders ($1,195 million) plus the earnings that have been retained and reinvested on their behalf ($5,206 million).
Just as it is sometimes useful to provide a common-size income statement, so we can also calculate a common-size balance sheet. In this case all items are reexpressed as a percentage of total assets. Table A.10 is Pepsi’s common-size balance sheet. The table shows, for example, that in 1998 cash and marketable securities fell from 9.6 percent of total assets to 1.4 percent.
LEVERAGE RATIOS
When a firm borrows money, it promises to make a series of interest payments and then to repay the amount that it has borrowed. If profits rise, the debtholders continue to receive a fixed interest payment, so that all the gains go to the shareholders. Of course, the reverse happens if profits fall. In this case shareholders bear all the pain. If times are sufficiently hard, a firm that has borrowed heavily may not be able to pay its debts.
The firm is then bankrupt and shareholders lose their entire investment. Because debt increases returns to shareholders in good times and reduces them in bad times, it is said to create financial leverage. Leverage ratios measure how much financial leverage the firm has taken on.
Комментариев нет:
Отправить комментарий